
90% of voters say 2026 Local Government Elections were free and fair – HSRC survey
Based on interviews with 13 198 voters across the nine provinces, preliminary findings of the Election Satisfaction Survey indicate that the electoral process continues to enjoy high levels of confidence among participating voters.
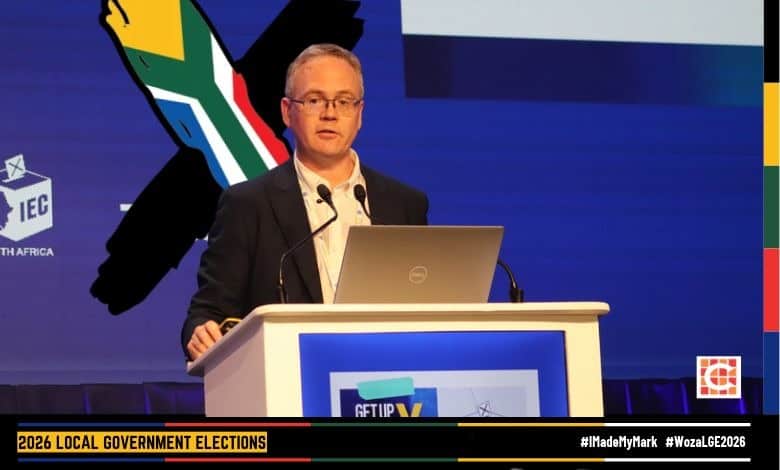
The Human Sciences Research Council (HSRC) has released the results of the Election Satisfaction Survey (ESS) 2026, conducted on Election Day, which was commissioned by the Electoral Commission of South Africa (IEC).
The intention of the survey was to establish voters’ opinions and perceptions on Election Day, said Dr Ben Roberts, research director of the HSRC’s Developmental, Capable and Ethical State division.
In the ESS, voters were asked a series of questions about the election process, including whether the elections were free and fair.
The survey also assessed the operational efficiency of the IEC in managing the elections, said Roberts.
The data presented is preliminary, pending a full report.
“Based on the research team’s interviews with voters, we can conclude that the voting public was positive about the electoral integrity of the 2026 Local Government Elections (LGE),” said Roberts.
“The voting public had a very positive appraisal of the Electoral Commission’s management of the elections and the conduct of officials at voting stations. Based on this analysis, the HSRC confirms that these elections were free and fair and that the Commission performed exceedingly well in the implementation and management of the country’s seventh LGE.”
How the survey was conducted
The sampling of the voting stations was proportional to the IEC’s distribution of registered voters and considered province, geographic type and the size of a voting station to ensure that a nationally representative sample of voting stations was selected and that the results of the survey could be properly weighted to the population of eligible voters in the country, said Roberts.
At the voting stations, fieldworkers used random sampling to select voters to ensure fair representation in terms of gender, race, age and disability status.
The ESS has been conducted during every major election in South Africa since the 1999 National and Provincial Elections, and the survey was designed so that the data collected in this round can be compared with past ESS results.
A sample of 300 voting stations countrywide was selected. The distribution of these voting stations and the resultant number of interviews at, and in the vicinity of, the stations were proportional to the IEC’s distribution of registered voters.
At each voting station, 50 voters were interviewed during the day. These were divided into four time slots to ensure a fair spread of interviews at different times.
Fieldworkers completed interviews with 13 198 respondents across the nine provinces, with a realisation rate of 88% (Table 1).
Lower than anticipated realisation rates were observed in the North West, but these were still within acceptable levels.
Table 1: Data collection realisation rate by province of voting station, 2026
| Province | Complete | Refused | Target | Realised |
| Western Cape | 1,397 | 239 | 1,550 | 90% |
| Eastern Cape | 2,105 | 57 | 2,350 | 90% |
| Northern Cape | 884 | 13 | 1,000 | 88% |
| Free State | 1,066 | 46 | 1,300 | 82% |
| KwaZulu-Natal | 2,154 | 148 | 2,450 | 88% |
| North West | 1,057 | 85 | 1,400 | 76% |
| Gauteng | 1,884 | 200 | 1,950 | 97% |
| Mpumalanga | 1,154 | 111 | 1,200 | 96% |
| Limpopo | 1,497 | 334 | 1,800 | 83% |
| TOTAL | 13,198 | 1,233 | 15,000 | 88% |
Voter satisfaction results
ESS survey participants were asked when they decided to participate in the current elections, with a large proportion reporting that they decided to participate long before the elections:
- 60% decided to vote more than six months before Election Day
- 20% decided one to six months beforehand
- 12% decided in the preceding month
- 5% decided in the final week
- 4% decided on Election Day.
“These findings indicate that most participants had made their decision well in advance, although approximately one in five decided within the final month,” said Roberts.
Reasons for voting
Respondents were also asked which factors had a major influence on their decision to vote.
The most frequently cited motivation in both elections was the belief that one’s vote makes a difference (internal political efficacy), mentioned by 59% of voters in the 2026 LGE and 61% in the 2024 National and Provincial Elections (NPE).
The civic duty to vote was mentioned by 38% of voters (40% in 2024). Other motivations in 2026 included the desire to secure good-quality and reliable government services (39% in 2026 vs 37% in 2024), improving the economy (38% in 2026 vs 39% in 2024), and fighting corruption (36% in 2026 vs 37% in 2024). By comparison, giving another political party a chance (26% in 2026 vs 27% in 2024) and support for a particular leader or candidate (22% in 2026 vs 26% in 2024) were less frequently cited.
The pattern of voting motivations remained remarkably consistent between the 2024 and 2026 elections, with differences of no more than 4% across all seven reasons.
“These findings suggest that electoral participation continues to be motivated primarily by a combination of belief in the value of voting, civic responsibility and concerns about government performance, rather than allegiance to individual political leaders or candidates.
“The prominence of service delivery, economic improvement and anti-corruption considerations also highlights the importance of substantive governance issues in shaping voters’ decisions to participate.”
Perceived level of tolerance during campaign period
Despite the highly contested nature of the political campaign, most voters felt that the political parties and independent candidates were tolerant of one another during the campaigns for the 2026 LGE.
“When asked about the level of tolerance, 63% of voters said that the campaign period was very tolerant and 23% told fieldworkers that it was somewhat tolerant. Only a small share of voters (7%) reported that the campaign was not tolerant, and 7% of the population said that they were uncertain about how to answer.”
The pattern of results is similar to what was seen during the 2021 LGE and the 2016 LGE.
Political representatives outside voting stations
A total of 93% of respondents voted at stations with political party representatives present outside the perimeter of the station. About 40% of respondents said they had been approached before entering by a political party or independent candidate representative offering assistance or checking details.
Voting station accessibility
Respondents were queried on how accessible the voting station was for persons with disabilities and the elderly.
Most voters evaluated the IEC favourably, with 86% saying the station was easily accessible for these groups. Both voters with disabilities (55% very accessible, 31% accessible) and very elderly voters (58% very accessible, 29% accessible) rated the station as accessible.
Understanding voting procedures
Voters were asked whether they thought the procedures inside their voting stations were easy or difficult to understand.
“We found that 58% of voters thought the procedures were ‘very easy’ to understand and 38% stated that they were ‘easy’. Less than 1% described the procedures as ‘difficult’ or ‘very difficult’ to understand. This is consistent with past rounds of the ESS, suggesting that voters are easily able to navigate the procedures for voting at their station. Satisfaction with signage and printed instructions was also high (95% satisfied or very satisfied).
Time taken to vote
To allow for a comprehensive assessment of the time it took to vote, ESS respondents were asked about the average time it took them to reach their station. For the 2026 LGE, the majority (90%) of voters said that it took them about half an hour or less to reach their voting station, including 66% who travelled for no more than 15 minutes. The remainder either said it took them between 30 and 60 minutes (8%) or over an hour (3%). This is an improvement over earlier major elections, especially in 2009, when average travel time was significantly higher.
Queue times were also short, with 78% queuing for no more than 15 minutes and 13% for 16-30 minutes.
“A total of 91% of voters queued for no longer than half an hour, and only 4% queued for more than an hour in 2026 LGE.
“Queuing performance improved substantially relative to the 2024 NPE. The share of voters who said they had to wait 15 minutes or less in the station queue rose from 60% in the 2024 NPE (and 52% in 2009, 64% in 2011, 66% in 2014, 72% in 2016, 76% in 2019, 77% in 2021) to 78% in the 2026 LGE. Moreover, the share who waited more than an hour fell from about 11% in the 2024 NPE to 4% in the 2026 LGE. These results represent a return to the comparatively short queues observed in the 2021 LGE.”
Satisfaction with ballot paper
Most voters were satisfied with the balloting procedures at their voting stations.
Approximately three-fifths of voters (62%) found it ‘very easy’ to find their preferred party or candidate of choice on the ballot in the LGE 2026 and 31% found it ‘easy’ to locate (93% combined).
This result is virtually equivalent to the pattern observed in the 2024 NPE (61% very easy, 32% easy) and only slightly lower than in the 2021 LGE (66% very easy, 26% easy). Only 2% of voters found it ‘difficult’ to find their party on the ballot and 1% asserted that it was ‘very difficult’.
Satisfaction with ballot papers was similarly high. A total of 94% were satisfied, with 58% ‘very satisfied’ and 35% ‘satisfied’.
IEC performance and conduct
ESS respondents were asked if they were satisfied or dissatisfied with the quality of service that the IEC’s officials provided to voters at the voting station.
“The HSRC found that 96% of voters were satisfied overall with the service provided by IEC officials, with 61% ‘very satisfied’ and 34% ‘satisfied’. Only a nominal proportion (1%) of voters were either ‘dissatisfied’ or ‘very dissatisfied’. The combined satisfaction level remained broadly consistent with previous elections (73% very satisfied in 2009, 69% in 2011, 69% in 2014, 59% in 2016, 69% in 2019, 65% in 2021, 65% in 2024), though the share reporting that they were ‘very satisfied’ was slightly lower in the 2026 LGE than it was in the 2024 NPE.
As part of the ESS questionnaire, respondents were asked to rate officials on six different attributes, namely friendly, patient, helpful, trustworthy, impartial and professional.
“A clear majority of the voter population gave electoral officials a positive rating on all of these indicators in the 2026 LGE:
- Helpfulness: 79% to a great extent, 20% to some extent (98% overall positive), 1% not at all, 1% don’t know.
- Patience: 78% to a great extent, 20% to some extent (98% overall positive), 1% not at all, 1% don’t know.
- Professionalism: 78% to a great extent, 19% to some extent (98% overall positive), 1% not at all, 2% don’t know.
- Friendliness: 77% to a great extent, 21% to some extent (98% overall positive), 1% not at all, 1% don’t know.
- Trustworthiness: 74% to a great extent, 21% to some extent (96% overall positive), 2% not at all, 3% don’t know.
- Impartiality: 65% to a great extent, 24% to some extent (90% overall positive), 7% not at all, 4% don’t know.
Consideration of voting procedure for voters with special needs
During the course of the ESS questionnaire, voters were asked how far they thought that voting procedures at the voting station considered the needs of vulnerable groups:
- The elderly: 67% to a great extent, 23% to some extent, 4% to a minor extent, 2% not at all, 5% don’t know.
- Persons with disabilities: 61% to a great extent, 23% to some extent, 4% to a minor extent, 4% not at all, 8% don’t know.
- The partially sighted and blind: 53% to a great extent, 21% to some extent, 4% to a minor extent, 4% not at all, 16% don’t know.
- Pregnant women: 52% to a great extent, 23% to some extent, 4% to a minor extent, 3% not at all, 17% don’t know.
- Voters with babies: 50% to a great extent, 24% to some extent, 4% to a minor extent, 4% not at all, 16% don’t know.
“The differences should be interpreted alongside variations in voters’ level of uncertainty in responding. While relatively few voters indicated that the needs of these groups were not accommodated, the proportion unable to provide an assessment was considerably higher for partially sighted and blind voters (16%), pregnant women (17%) and voters accompanied by babies (16%), compared with elderly voters (5%) and persons with disabilities (8%).
“This greater uncertainty may reflect limited personal experience of, or exposure to, the specific accommodations provided for these groups, rather than necessarily indicating shortcomings in their provision. The findings therefore suggest that voting arrangements were generally perceived as inclusive, although awareness and visibility of accommodations for certain groups may warrant further attention.”
Voter education
The IEC was interested in assessing whether voters felt adequately informed about voting procedures ahead of the 2026 LGE.
As part of the ESS, respondents were asked whether they had enough information about the voting procedures (including registration and the location of the voting station) before the elections.
The findings indicate that nearly three-quarters (73%) of voters felt they had received sufficient or more than sufficient information about voting procedures. Just over half (54%) considered the amount of information they received to be adequate, while 19% felt they had received too much or far too much information. By comparison, approximately a quarter (25%) reported having insufficient information, comprising 13% who indicated that they had received too little information and a further 13% who felt they had received far too little.
“Overall, these results suggest that most voters felt adequately informed about the voting process, although a minority perceived gaps in the information available to them ahead of Election Day.”
The ESS also assessed voters’ perceptions of the effectiveness of the IEC’s voter education campaign. Overall, 88% of voters rated the campaign as effective, comprising 60% who considered it very effective and 28% who regarded it as somewhat effective. Only 4% considered the campaign ineffective, while the remaining 8% were uncertain.
“This represents a modest decline from the 2024 NPE, when 90% rated the campaign as effective (66% very effective and 24% somewhat effective). The decline was concentrated in the proportion giving the highest effectiveness rating, rather than in overall positive assessments (historical very effective ratings: 64% in 2009, 68% in 2011, 65% in 2014, 63% in 2016, 62% in 2019, 59% in 2021).
Overall trust in the IEC
Approximately four-fifths (81%) of participants indicated that they either trusted or strongly trusted the election management body.
“While this represents a slight decline from the levels recorded in the LGE 2016 (91%), LGE 2019 (93%), LGE 2021 (89%) and NPE 2024 (85%) elections, confidence in the IEC remains high among participating voters.
“Comparisons with nationally representative surveys conducted by the HSRC also indicate that those who participate in elections tend to express considerably higher levels of trust in the Commission than the general adult population.”
Among the 81% of voters expressing trust, the emphasis was primarily on the IEC’s professionalism and competence in managing elections, the fairness, impartiality and independence of its operations, and confidence in the accurate counting of votes and the integrity of electoral procedures.
Among the 5% expressing distrust (with 14% being neutral/uncertain/refusal), recurring themes were perceived corruption or dishonesty, doubts about vote counting and results, perceived political bias, past controversies and media reports, and broader political or institutional distrust.
Freeness and fairness
ESS respondents were asked if they were satisfied or dissatisfied with the safety and security provided at the voting station. While 64% said they were ‘very satisfied’, 31% stated that they were satisfied.
In addition, a large majority of the voting population expressed satisfaction with the secrecy of their vote.
About three-fifths (64%) said that they were very satisfied and 31% said they were fairly satisfied.
Only a minor proportion of voters conveyed dissatisfaction with the secrecy of their vote, with 1% being dissatisfied or very dissatisfied.
“Comparing these findings over time, it is clear that there has been a distinct decline in the share stating that they were ‘very satisfied’ between survey rounds in 2009 (81%), 2011 (76%), 2014 (73%), 2016 (62%), 2019 (68%), 2021 (69%), 2024 (67%), and 2026 (64%).
Accuracy of vote counting
The bulk of 2026 LGE voters believed that their vote would be counted accurately. More than half (51%) of voters were completely confident that their votes would be accurately counted. A significant proportion (32%) said that they were very confident, and 9% of voters were quite confident.
A small minority stated that they had little confidence that their vote would be counted accurately (4%) and 2% were not confident at all. This level of confidence was an improvement on what was observed in the 2024 NPE.
The overwhelming majority of participants (90%) said that voting was free and fair.
A marginal fraction of voters in the 2026 LGE believed that there had been minor problems (4%) and 2% said the elections were not at all free. These figures correspond to what was seen in past rounds of the survey (95% in 2009, 95% in 2011, 94% in 2014, 90% in 2016, 92% in 2019, 91% in 2021, 92% in 2024).
The ESS 2026 findings point to a strong commitment to continued electoral participation among those who voted in the 2026 LGE. An overwhelming majority (96%) indicated that they were likely to vote in future elections, comprising 80% who were ‘very likely’ and a further 16% who were ‘somewhat likely’ to do so.
Breaking news at your fingertips… Follow Caxton Network News on Facebook and join our WhatsApp channel.
Nuus wat saakmaak. Volg Caxton Netwerk-nuus op Facebook en sluit aan by ons WhatsApp-kanaal.
Read original story on www.citizen.co.za

