Roots survey results are in
Surveys are conducted within the distribution areas of Caxton Local Media publications, with 97 area surveys conducted across the country.
THIS year, the statistics for the Roots survey were collected digitally for the first time, following previous years’ surveys which saw door-to-door data collection. The survey serves to offer advertisers more information on the demographics of an area.
To report back on the 2022 results was research strategist Lynne Krog of Sparks Media who visited Durban’s Onomo Hotel today, Thursday, November 1.
While the survey is usually conducted every three years, the 2022 survey marks the first survey since the Covid-19 pandemic broke out.
“The fieldwork for the last survey was done in 2018, which was pre-Covid, so it’s really exciting to look at the data post-Covid and the way data is being collected differently. It’s a bit of an evolution,” said Krog.
Data once collected in person was collected digitally this year, and Sparks Media, which conducts the Roots Survey, commissioned Borderless Access for the task.
“They have an online consumer panel of about 300 000 people here in South Africa, and they have been building and developing it for the last 15 years,” said Krog.
Surveys are conducted within the distribution areas of Caxton Local Media publications with 97 surveys conducted across the country. The digital survey contains the same questions as the in-person survey.
“We know what questions to ask because we have been doing this since 1980. The questions stay the same, but the way data is collected has changed,” said Krog.
She added that the digital medium allows for rich, in-depth data collection.
“The future of engaging with consumers from a research perspective is through online panels. The questions are presented in a format you can answer on your phone, and for more involved answers, participants can record themselves talking or record a video,” explained Krog.
The survey serves to offer advertisers more information on the demographics of the area.
“If you are a reputable medium, you have to spend money to get a measurement of how many people are viewing an advertisement,” said Krog.
Here are some statistics and demographics gathered for distribution areas for Northglen News, Highway Mail and Berea Mail:
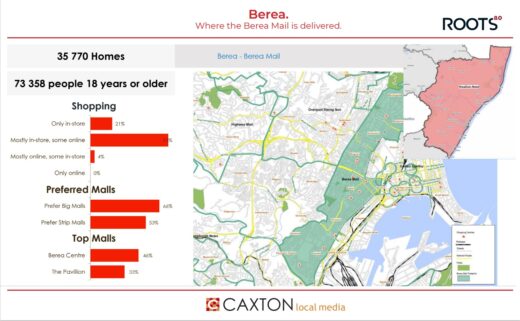
Berea
35 770 homes in Berea were surveyed, where 73 358 people were 18 and over. Of the homes surveyed, the average monthly household income was R26 744.
62 898 people read a local newspaper in a four-week period – 55% of readers are female and 45% are male.
77% are fluent in English, 46% in isiZulu, 35% in Afrikaans, 12% in Xhosa, 5% in Sotho and 3% in SiSwati.
66% of people surveyed prefer big malls while 53% prefer strip malls. The top mall was Berea Centre (46%) followed by The Pavillion (33%).
21% of people surveyed shop in-store only, 75% shop mostly in-store with some online purchases, and 4% shopped mostly online.
ALSO READ: eThekwini Municipality to install smart meters
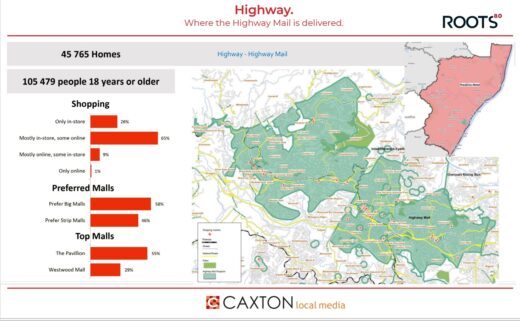
Highway area
The survey included 45 765 homes where 105 479 people were 18 and over. The average monthly income per household was R40 740.
85 663 of people surveyed read a local newspaper in a four-week period – 53% female readers and 47% male.
96% of those surveyed were fluent in English, 39% in isiZulu, 36% in Afrikaans and 12% in Xhosa.
Of those surveyed, 26% shop in-store only, 65% shop mostly in-store with some online purchases, 9% shopped mostly online and 1% shopped online only.
The survey reflected that 58% of people prefer big malls while 46% prefer strip malls. The top mall was The Pavillion at 55%, followed by Westwood Mall at 29%.
ALSO READ: Metro Police use innovative technology to combat crime in the City
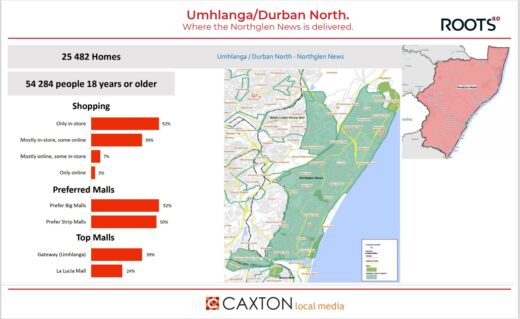
Umhlanga
In uMhlanga, 25 482 homes were surveyed, where 54 284 people were 18 and over. The average monthly income per household was R39 639.
Of those surveyed, 43 429 read a local newspaper in a four-week period – 53% female readers and 47% male.
There were 73% fluent in English, 42% in isiZulu, 24% in Afrikaans and 9% in Xhosa.
The survey reflected that 52% of people shop in-store only, 39% shop mostly in-store with some online purchases, 7% shop mostly online and 3% shop online only.
There were 52% of people who preferred big malls while 50% preferred strip malls. The top mall was Gateway at 39%, followed by La Lucia at 24%.
For more from Berea Mail, follow us on Facebook or Twitter. You can also follow us on Instagram.