
Most South Africans had 53% less disposable income in 2024 than in 2016 …
Results from supermarket retailers show a sharp divergence in performance between the more affluent end of the market versus the mass market. Picture: iStock
The middle class in South Africa is under severe strain, easily the most stress in two decades. There are signs of this everywhere you look.
Results from supermarket retailers show a sharp divergence in performance between the more affluent end of the market versus the mass market (Checkers is soaring, while Shoprite is battling as its customers increasingly trade down to U-Save, for example).
According to data from WeBuyCars, the used vehicle market has delivered a compound annual growth rate of 1.1% in the last seven years, while for new cars, this is a 0.8% decline. It has also shared data on how the vehicle parc in the country is ageing, as South Africans are holding onto their cars for longer.
Fashion retailers, notably Mr Price and TFG have turned their focus to the “value” segment as a growth engine (while Pepkor continues to acquire rivals to expand its share of that market).
Mainstream fast-food outlets are quieter at lunch hour than they were a year or two ago. This is especially noticeable in the week before payday (often popularly referred to as “mampara week”.
ALSO READ: Will the working class ever be able to join the middle class?
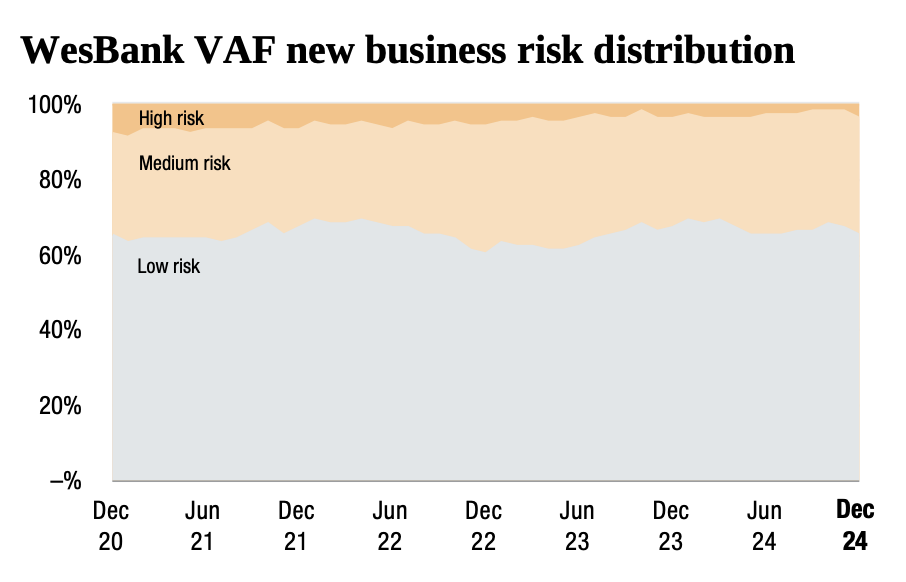
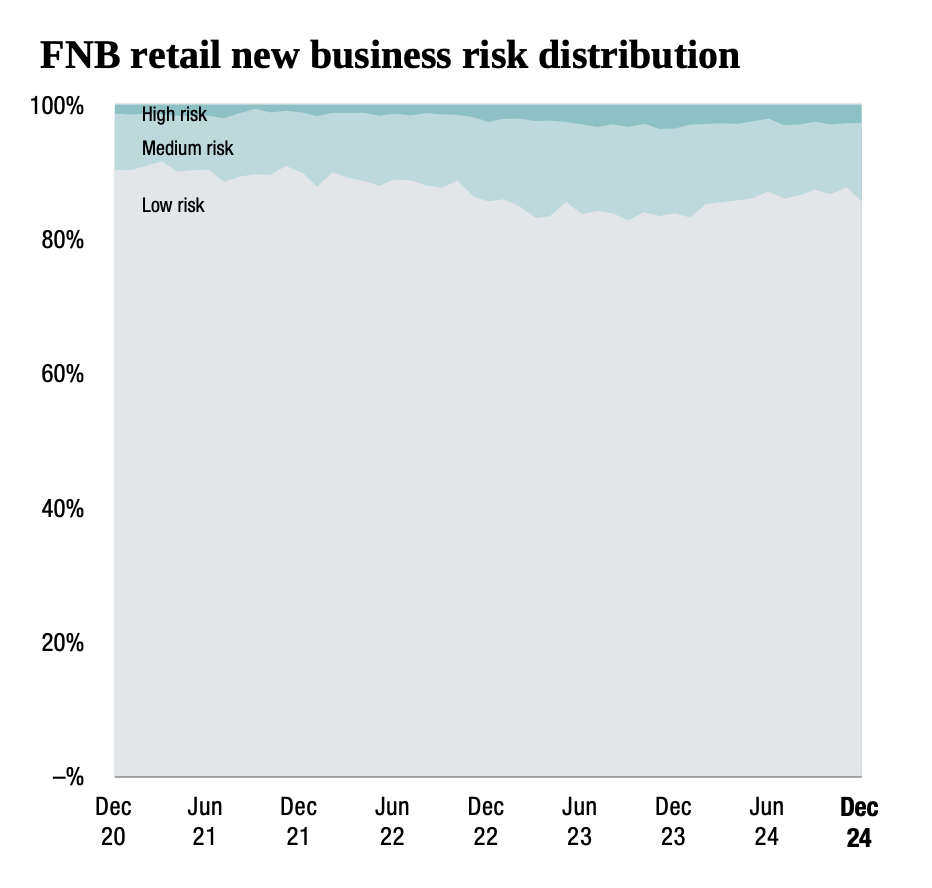
Banks have been open about how they are prioritising lending to their more affluent (and, therefore, less risky) segments. While banks tend to have different risk appetites and origination strategies, FirstRand’s focus over the last four years is telling, as the charts below show.
The irony is that many – perhaps most – reading this are not categorised as middle class, at least according to the Bureau of Economic Research’s definition.
It defines middle class households as those earning between R5 000 and R20 000 a month (research outfit Eighty20 defines this at a more affluent R8 000 to R30 000 a month).
ALSO READ: How does South Africa’s middle class feel heading into Dezemba?
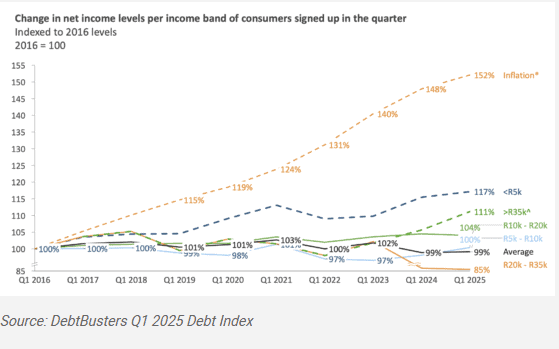
A shocking chart shared by fintwit The Finance Ghost on X earlier in August garnered a lot of attention. The chart was part of a presentation from TFG’s capital markets day, and the ghost also referenced it in his recent Supernatural Stocks Podcast. The chart is originally from DebtBusters, which publishes a quarterly analysis of consumers that have applied for debt counselling.
While that chart may be shocking, there are a few others in its index for Q1 that clearly show the slow and steady decimation of South Africa’s middle class over the last nine years.
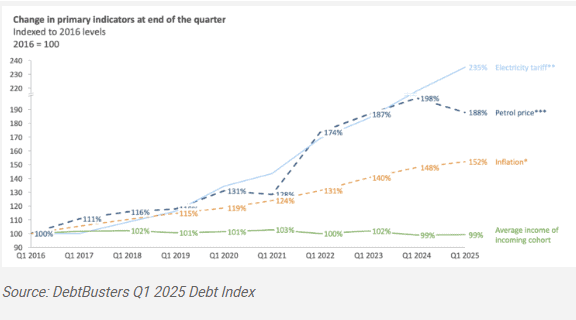
First, it says the primary indicators of the cost of living “have moved substantially faster than income growth” since 2016.
Here, it has tracked the movement of inflation (CPI), the petrol price, and the price of electricity over the period. Inflation is up 52%, the price of fuel by 88%, and electricity by 135% since Q1 2016. Importantly, it highlights that lower income groups have experienced an inflation rate that is two to four percentage points higher in the last few years, due to their mix of expenditure items.
ALSO READ: It’s not just the middle class, top 5% feeling debt pain too
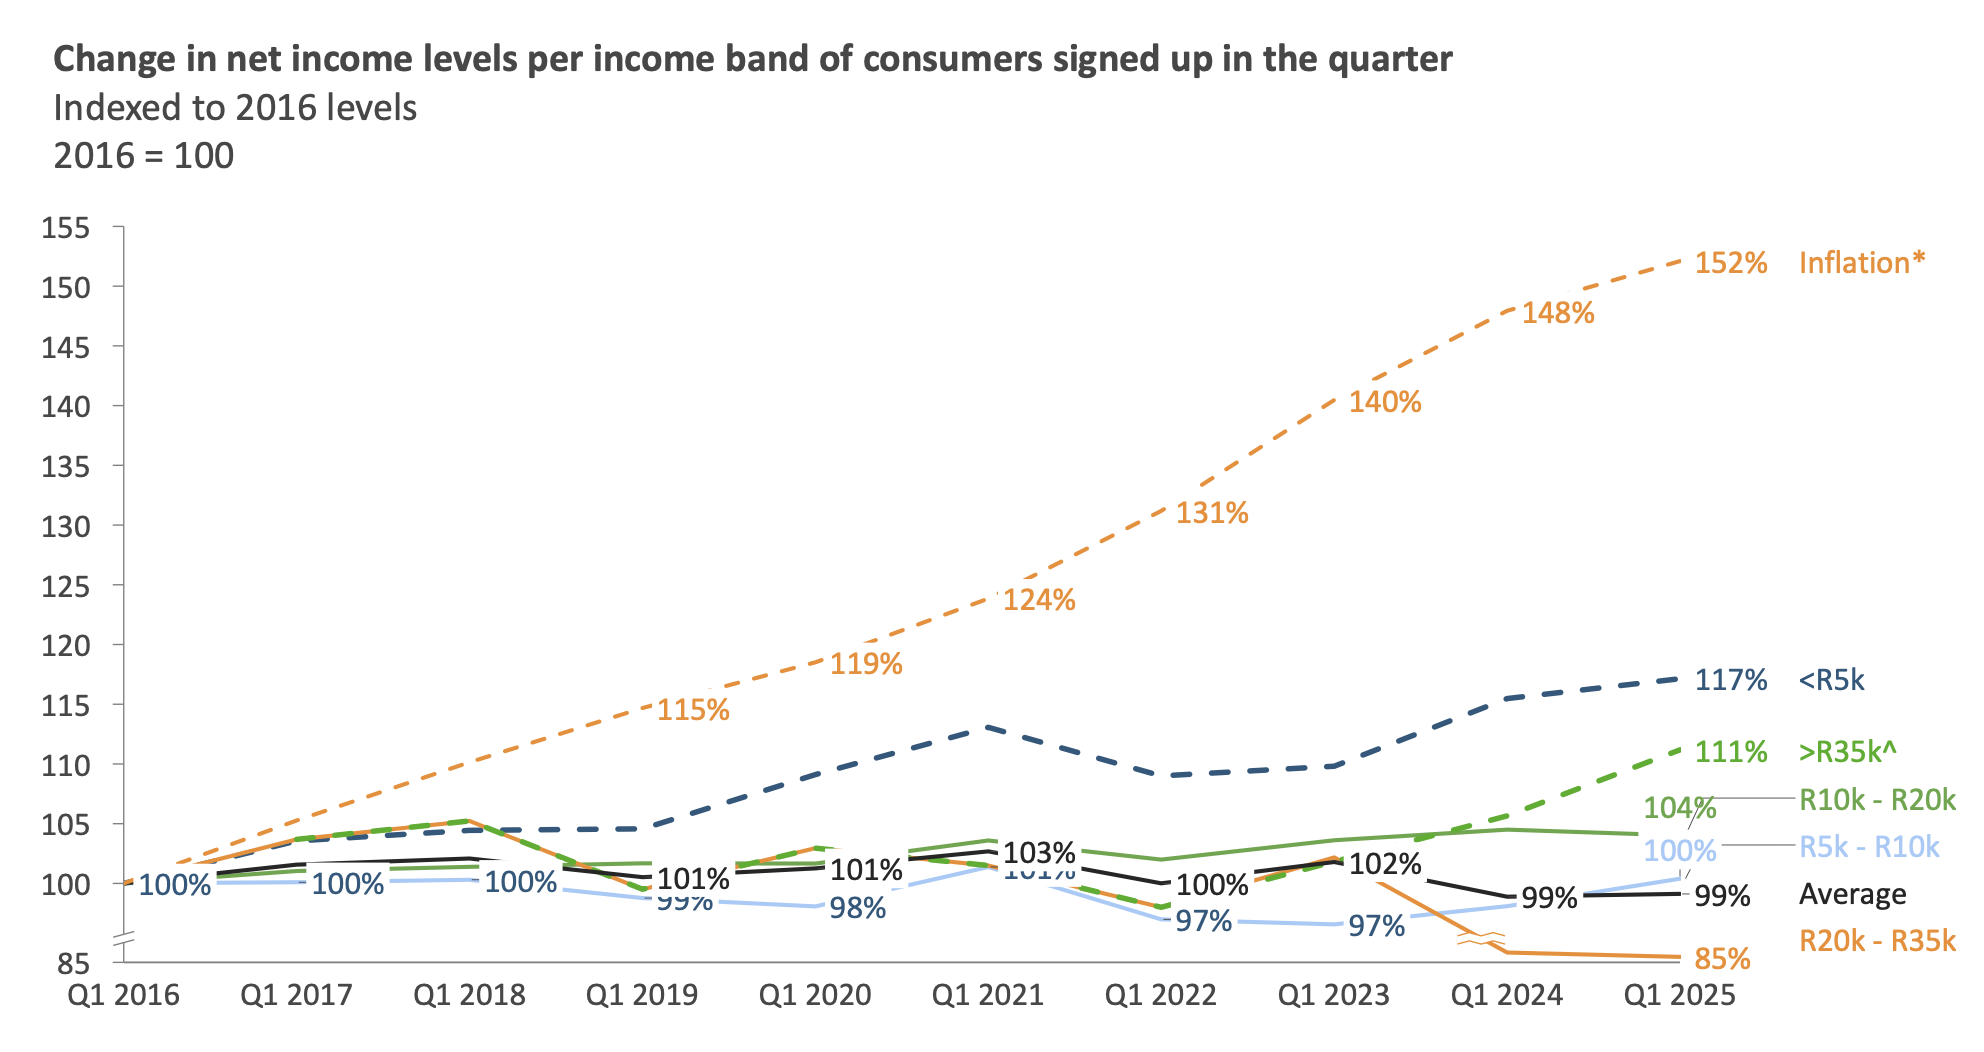
The problem is that the average income of the incoming cohort of DebtBusters clients is practically flat over the last nine years. Technically, the average income decreased by 1% during this period.
It says that “in real terms, most South Africans had 53% less disposable income in 2024 than in 2016.” The divergence between different income cohorts is stark.
In what most readers of this website would categorise as the ‘most’ middle-class segment (with an income of between R20 000 and R30 000 per month), incomes are at 85% of what they were in 2016.
This is what is cascading through the various financial results of JSE-listed companies in recent months …
ALSO READ: Repo rate cut too little too late for consumers on edge of financial ruin?
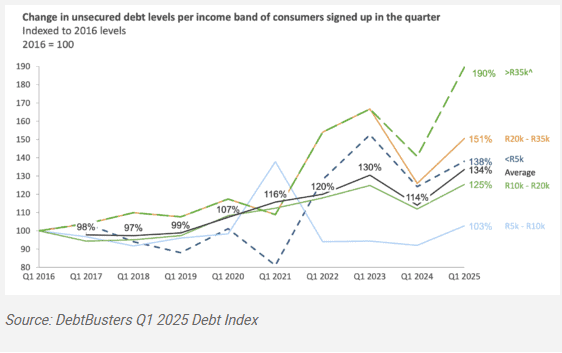
This can be seen in the rising debt levels across various cohorts, with consumers – on average – having 34% more unsecured debt in 2025 compared to 2016. It says “those taking home R35 000 or more have unsecured debt levels that are 90% higher than in 2016.
This outpaces CPI growth of 52% and is much higher than salary growth of 11% during the same period for the top earners”.
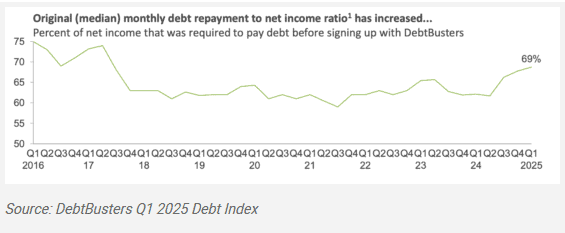
Overall, one can see that the overall “debt service ratio is higher where consumers need 69% of their take-home pay to service debt, which is a significant increase from previous quarters and is at the highest level since 2017.”
This article was republished from Moneyweb. Read the original here.
Support Local Journalism
Add The Citizen as a Preferred Source on Google and follow us on Google News to see more of our trusted reporting in Google News and Top Stories.