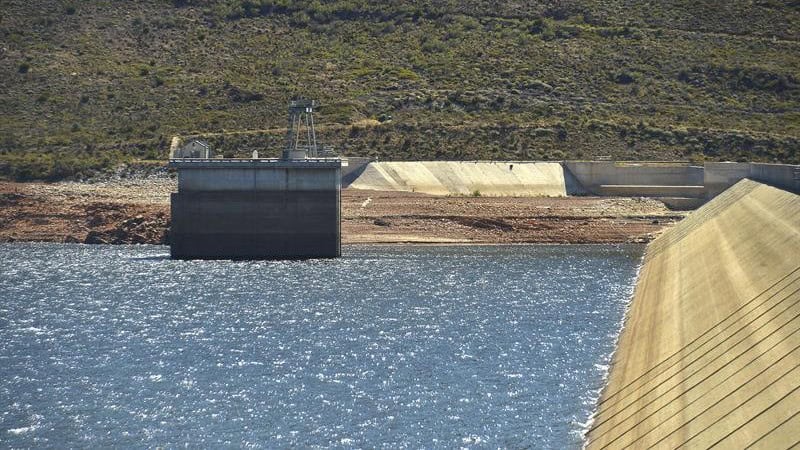
The city's water supply system remains healthy despite a slight decline from the previous week.

Cape Town’s collective dam levels stood at 89.9% on 20 October 2025, down from 90.7% the previous week.
The Western Cape Water Supply System currently holds 807 582 megalitres of water across its six major dams.
The City of Cape Town and the National Department of Water and Sanitation measure dam levels to check how much water is available for the region.
The measurements also determine whether water restrictions are necessary for residents and businesses.
Integrated water supply system
“The dams in and around Cape Town form part of the Western Cape Water Supply System, which is an integrated and collectively managed system of dams, pump stations, pipelines, and tunnels,” the city said.
“In addition to servicing Cape Town, the system supplies water to towns in the Overberg, Boland, West Coast, and Swartland areas, and provides irrigation water for agriculture.”
The total capacity of the six major dams stands at 898 221 megalitres when full.
ALSO READ: Live in these Cape Town areas? You could get your water meter replaced — here’s why
Individual dam levels
Berg River Dam recorded the highest level at 99.8%, holding 130 010 megalitres of its total capacity. The dam dropped slightly from 99.9% the previous week.
Voëlvlei Dam maintained strong levels at 99.3%, storing 164 095 megalitres. This represents a decrease from 99.9% the week before.
Steenbras Upper Dam stood at 99.2% with 31 767 megalitres stored. The facility declined from 99.8% in the previous week.
Steenbras Lower Dam registered 93.2% capacity with 33 517 megalitres. This showed a decline from 94.2% in the previous week.
Wemmershoek Dam held 58 644 megalitres at 85.0% capacity. This marked a drop from 86.5% the previous week.
Theewaterskloof Dam, the largest in the system with a capacity of 480 188 megalitres, recorded 83.8% storage. The dam decreased from 84.7% the week before.
Year-on-year comparison
According to the city’s weekly report, dam levels remain below the same period in 2024 when total storage reached 99.2%. At this time last year, the system held 890 866 megalitres across all major dams.
Theewaterskloof Dam showed the most significant year-on-year difference, dropping from 100% capacity in October 2024 to 83.8% currently.
Berg River Dam improved slightly from 99.6% last year to 99.8% this year.
Because each dam size is different, the best indicator of overall dam water levels is the total quantity stored expressed as a percentage of total dam capacity.
Support Local Journalism
Add The Citizen as a Preferred Source on Google and follow us on Google News to see more of our trusted reporting in Google News and Top Stories.


