SA’s in the middle of a financial firestorm.

I just love charts. I’ve spent most of my waking days and nights looking at them – literally, hundreds. Every one tells me a different story. Some go back 100 years – such as the Dow Jones Industrial index – while others show what’s happened during the most recent five minutes in forex markets.
A while ago I even saw a chart of Dutch bond yields going back almost 400 years. How cool is that?
Charts are great servants of researchers and journalists, especially in today’s digital world, where a great deal of charting information is free. For those who can afford advanced charts, on offer by Bloomberg, it’s charting heaven.
Charts cuts through the waffle, spin and downright lies – of which there is much peddled day in and day out in modern-day South Africa – by both government spin doctors and the private sector.
I wish to discuss three charts.
While seemingly unrelated, all have one thing in common: they vividly and painfully illustrate the financial calamity embracing every one of you reading this column.
I’ve been trying to warn readers of this website for some time that SA’s finances – at government and on a personal level – are heading for a spectacular meltdown, which could last for many years and possibly become the new normal. In other words, it’s not cyclical this time but structural, permanent. The ramifications would be far worse than most pessimists would ever have considered.
There’s no joy in reaching this conclusion, no schadenfreude (pleasure at another’s misfortune). My rewards have been few and far between. A long-time and very dear friend calls me the ‘Leonard Cohen of financial writing’. Others have been, as expected, forthright and blunt, engaging me in a not-so-cerebral discussion, using words that don’t exceed four letters.
But my views are based on the charts I see and analyse. If the Nelson Mandela Foundation can describe the current political situation in SA as one where the “wheels are coming off”, then I can surely paraphrase that statement and claim that the “financial wheels are coming off”.
We are, in my view, already well past the embryonic stages of this meltdown and are now smack bang in the middle of a financial firestorm which could worsen if/when our foreign debt is downgraded by two of the three global credit ratings agencies in the near future.
1.SA debt levels at highest levels ever
Take a look at this chart of SA’s government debt.

Source: MyBroadband, here
Words are almost not needed. It tells a story of a government hell-bent on spending its way into oblivion. As pointed out by finance minister Pravin Gordhan in his recent Medium-Term Budget Policy Statement (MTBPS), the cost of servicing this debt is now the second largest item in SA’s budget. A downgrade would further exacerbate this trend, as higher interest rates – which government also pays – will push our debt repayments to unprecedented levels.
Guess under which finance minister most of our runaway spending occurred? The venerable Gordhan, who now seems to have garnered the status of a financial and political saint. If Gordhan couldn’t contain government spending during his previous stint as finance minister, on what grounds can he be called upon to stop it now?
As such, the MTBPS was completely devoid of any urgency in unlocking the suffocating levels of despondency amongst the business community and consumers.
All we were told with certainty was (a) the poor won’t be affected by any tax increases and (b) Gordhan needs to raise an estimated R47 billion over the next two years.
Pulling such a large amount of money out of the pockets of consumers and taxpayers – at a time when confidence and spending levels are already rock bottom – does not augur well for retailers, the residential property market and the sale of new motor vehicles, just for starters. Today’s depressed levels might be remembered fondly in a year or three from now. And then Treasury is expecting an upturn in economic growth over the next two years. Pull the other one.
2.Residential property market
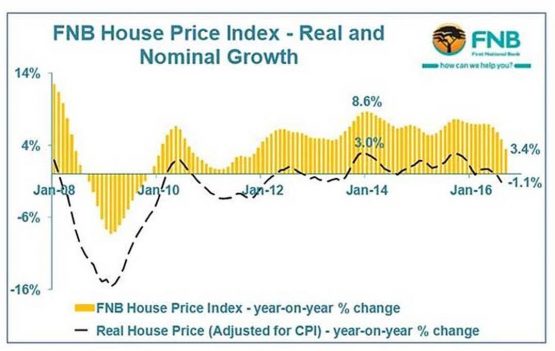
As several of my columns have pointed out over the past two to three years, this market – aside from the Western Cape (WC) – is very firmly in the grip of a severe, almost eight-year bear market. In real terms, you haven’t made any money beating the inflation rate over this period. Over the past two years you’ve been losing money against inflation and, in some cases, we’re starting to see a decline in rand-terms.
This is a toxic sludge if you’ve been using gearing to try to make money in the buy-to-let market – which is still being promoted, but less so in recent months.
You cannot hope to make money using gearing if your cost of capital is eg 11%, while the value of the underlying asset you’ve geared is only rising by 3% or 4% per annum. And, the rentals to service the gearing are also only growing at about 5% per annum, with as much as 25% of SA tenants not paying on time or at all, according to Tenant Profile Network’s latest figures.
Mainstream financial media spends a lot of time and effort trying to pretend this isn’t happening. Property advertisers spend a great deal of money via these mediums and negative reporting on the property market is strongly discouraged.
The rapid growth in property prices in the WC – evident since about the time the Democratic Alliance took control of the province in 2009 – is disguising how bad other provinces are doing, if one takes a look at this chart in the latest FNB Property barometer.
Average WC property prices are now almost 25% higher than elsewhere. The momentum line for the growth of prices in smaller provinces is heading towards zero.
Obviously this chart can only apply to property prices where transactions are still being recorded. None of the major property surveys in SA (Absa, FNB and Pam Golding) give a breakdown of the turnover and actual sales in these areas, but I’m convinced that in many smaller towns in SA – besides the WC – property transactions have completely dried up. So, if there are no sales there is nothing to measure.
Have I turned bullish on property?
One sharp-eyed reader emailed Moneyweb editor Ryk van Niekerk last week, asking whether I’ve suddenly turned bullish on the residential property market, based on the fact that I’ve recently purchased two properties in the Western Cape.
One property is a lock-up and go at the magnificent Val de Vie development outside Paarl (the smallest property on the estate) and the other an even smaller two-bedroom unit in The Yacht Club on the Cape Town Waterfront. Both were purchased from the proceeds of sales of properties up north.
The flood of well-heeled buyers from Gauteng and other northern regions continues unabated, with over 50% of buyers at Val de Vie from Gauteng. While Steyn City (outside Fourways in Gauteng) is battling with sales, Val de Vie cannot keep up and has sold over R1.6 billion worth of property over two years. Most of the phases (Polo Village, Gentleman’s Estate, River Club and even the Polo Village offices) have hung up the sold-out sign, according to sales director Renier Swart.
I don’t know how long this trend will continue, but after recently spending a week in the Cape, I’m more than convinced it has some miles to go.
3.JSE under water over one, two and soon three years
For a while since the 2007/2008 Great Financial Crisis, investors on the JSE made very good returns and, over seven, five and even four years, investors are still well ahead of the inflation rate.
However, over one and two years, this situation’s been reversed; even over three years investors in the JSE All share index have barely scraped by ahead of inflation.
One reason is that overseas buyers – who enthusiastically bought up our shares during the good times – have been aggressive sellers of these stocks over the past year, ever since the Nenegate-scandal broke.
In another chart (available for those interested), the under-performance of the JSE versus the MSCI emerging market index (-1,2% versus +9%) over the past 12 months is notable. In short, global investors have been dumping SA shares in record numbers ahead of an expected downgrade later this year or next year.
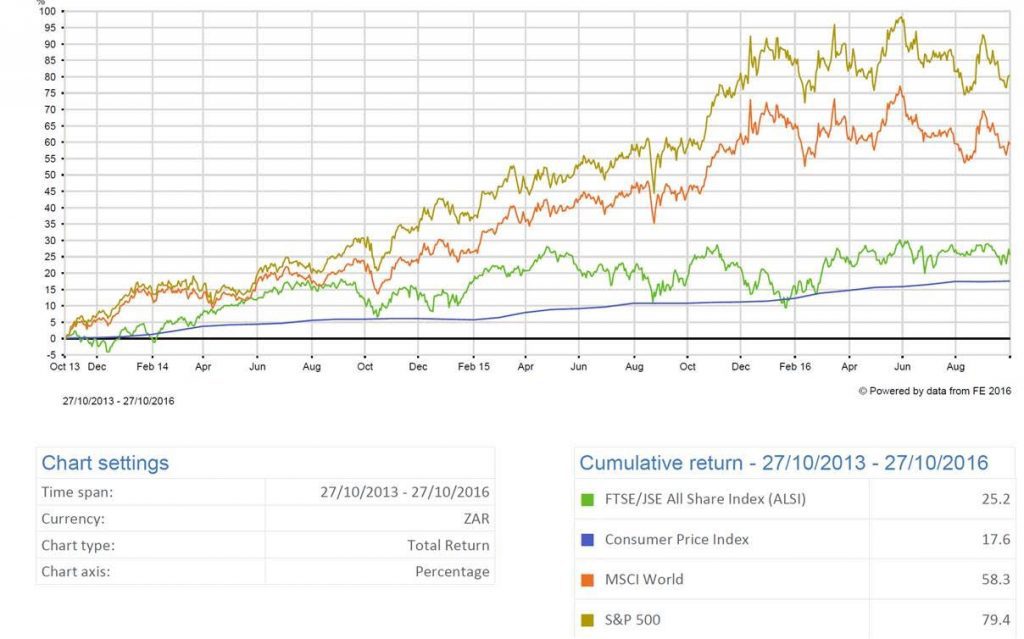
The same applies to the money market returns (before tax) over the same period of time.
This is what the third chart is telling us.
For investors hoping for a quick return to the boom-times when markets bounded ahead year after year, at between 15% and 18%, my advice is to temper your expectations. The JSE is not cheap by any standards and if one strips out the effect of the market cap weighting of Naspers, now equal to almost 20%, it shows the market is in serious trouble.
And then there’s the looming downgrade.
What this all means to me is that most people, with the exception of the super-rich with globally-diversified investments portfolios, are facing a prolonged and drawn-out squeeze of their personal wealth. Additionally, business profits and salary increases aren’t keeping up with inflation, according to the latest BankservAfrica survey.
Government would like to put as much blame as possible for this long drawn-out financial calamity on global factors. Initially this was true but, as the scale and momentum of the mismanagement, corruption, theft, policy indecision and confusion picked up speed under the Jacob Zuma administration, it became clear that these were self-inflicted wounds.
Would the removal of Zuma improve matters?
I don’t think we will be seeing the back of Zuma very soon. In fact, we might even be witness to his scorched earth economic and political policies in the near future.
*Magnus Heystek is the investment strategist at Brenthurst Wealth. He can be reached at [email protected] for ideas and suggestions.
-Brought to you by Moneyweb