
Although only a short sample, rainfall in the last week across Cape Town has been lower than the long-term average.
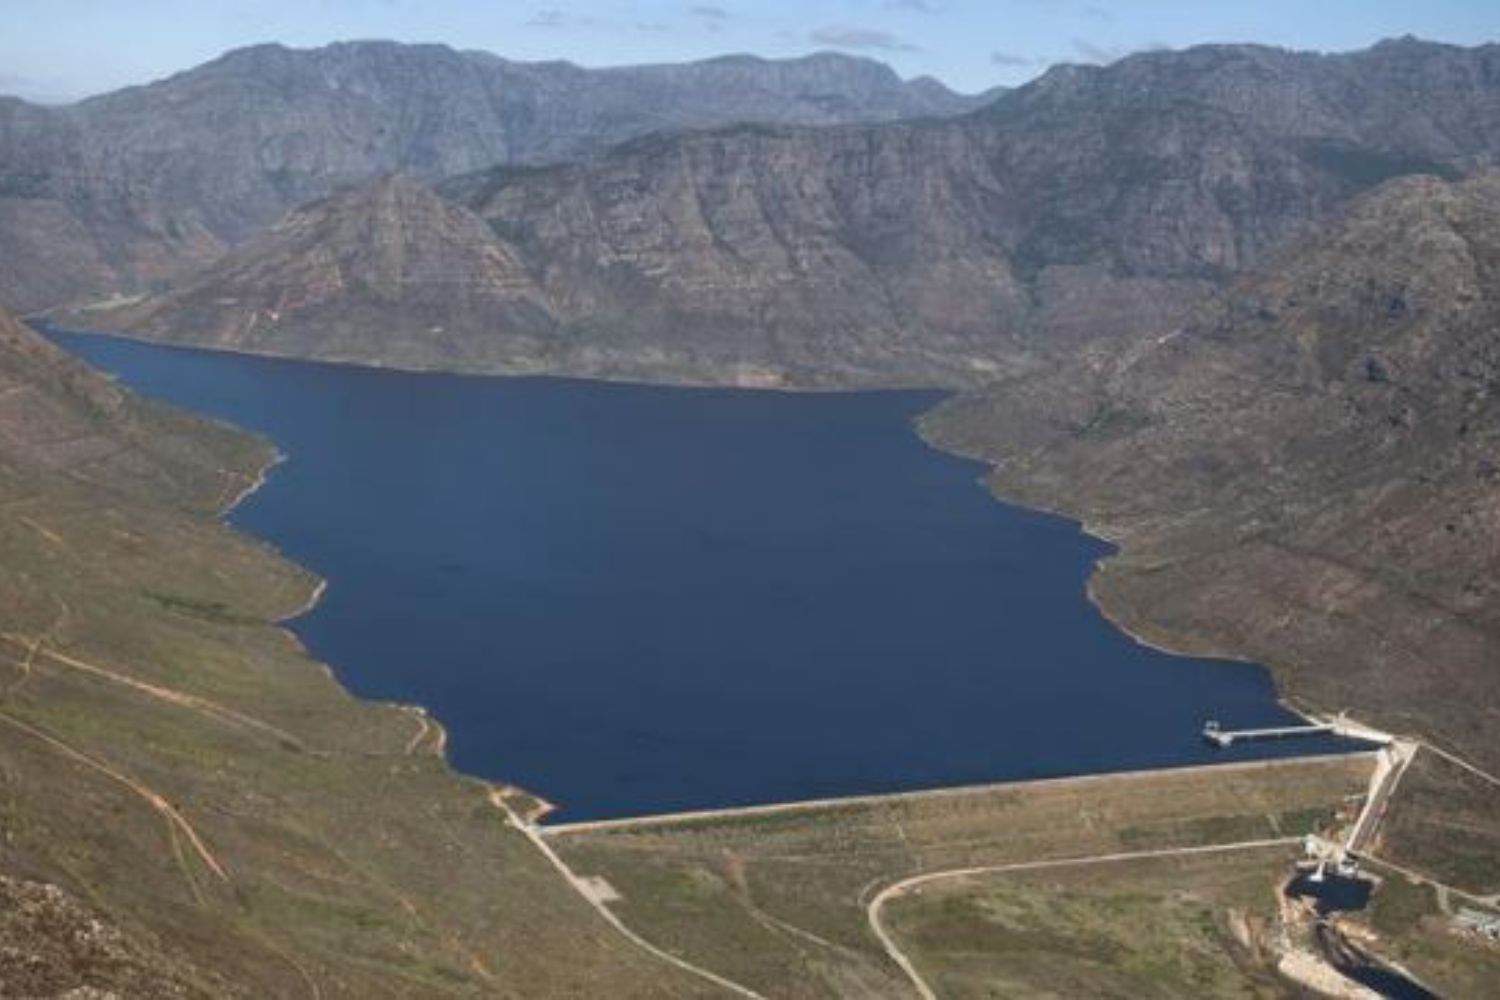
Picture: Berg River dam
Cape Town’s dam levels currently stand at 90.5%, maintaining relatively stable water reserves ahead of the city’s dry season.
The Western Cape Water Supply System recorded 813,285 megalitres of stored water as of Tuesday, representing a 1.2 percentage point increase from the previous week.
“The dam levels are critical for Cape Town’s water supply,” the City of Cape Town stated.
The municipality works alongside the national Department of Water and Sanitation (DWS) to monitor reservoir levels and determine when water restrictions become necessary for residents and businesses.
Current dam storage levels show strong performance
The six major dams serving Cape Town and the surrounding regions demonstrate robust water security.
This week, the Berg River Dam is at 100.4%, increasing from last week’s 100.0%.
Steenbras Upper followed it at 99.7%, which went down from last week’s 101%.
Voëlvlei stands at 94.8%, another decrease from last week’s 93.9%.
While Steenbras Lower holds 94.8%, it has decreased from 96.0%.
Furthermore, Wemmershoek sits at 91.8% a slight increase from 91.7% the previous week.
Lastly, Theewaterskloof, the largest reservoir, contains 85.5% of its 480,188 megallitre capacity.
This was a slight decrease from last week’s 85.6%.
These reservoirs form part of an integrated system serving multiple regions.
“In addition to servicing Cape Town, the system supplies water to towns in the Overberg, Boland, West Coast, and Swartland areas, and provides irrigation water for agriculture,” according to the city.
ALSO READ: Vaal Dam level still leaves surrounding businesses gatvol [VIDEO]
Weekly trends show mixed results
Comparing current levels to the same period in 2024 reveals some interesting insights.
Total stored water reached 929,116 megalitres in August 2024, higher than this year’s 814,084 megalitres as of Wednesday. It’s worth noting that this is an increase from last week’s 813,285 megalitres.
This represents a capacity difference of 103.4% in 2024 versus 90.5% currently.
Individual dam performance varies when measured against 2024 levels.
Berg River matches last year’s performance at 100.8%.
Theewaterskloof and Voëlvlei both exceeded 2024 levels at 104.3%.
However, Steenbras Lower dropped from 102.9% to 96.0%, while Steenbras Upper fell from 103.8% to 101.0%.
Despite the 1,2 percentage point increase in dam levels over the last week, there is still less water in dams, during the same period, than over the last three years.
ALSO READ: ‘Below-normal’ winter rainfall: Current levels of SA’s largest and most popular dams
Rainfall patterns remain below average
Recent rainfall across Cape Town has fallen short of long-term averages.
The extended weekly water report shows varied rainfall distribution across monitoring stations.
Theewaterskloof recorded 2.8 millimetres while Voëlvlei measured 34.9 millimetres during the reporting period.
Accumulated monthly rainfall at Wemmershoek station provides historical context for current conditions.
The 2024/2025 season tracks below previous years, with the current year’s curve falling beneath both 2023/2024 and 2021/2022 patterns.
Research from the University of Cape Town’s Climate System Analysis Group indicates shifting rainfall patterns across the region over the past five years.
Their findings suggest a delay in seasonal precipitation, which aligns with current observations.
Future water security questions
Despite strong current dam levels and stable consumption patterns, questions persist about summer water security for the city.
Historical data suggests dam levels typically decline during Cape Town’s dry season later in the year.
Current storage levels provide a buffer against seasonal decline, though officials maintain vigilance given recent rainfall deficits.
NOW READ: Weather alert: Hot weather to linger over five provinces until next Tuesday
Support Local Journalism
Add The Citizen as a Preferred Source on Google and follow us on Google News to see more of our trusted reporting in Google News and Top Stories.